2016 was a breakout year for Canadian equities. After trailing the US stock market in the preceding five calendar years, the S&P/TSX Composite bounced back in 2016 with a gain of 21.1%, compared to a gain of 8.6% for the S&P 500 (including currency effects) - great news for your Canadian equity investments.
If your investment manager’s strategy is to invest in high quality Canadian stocks, however, 2016’s performance may have seemed disappointing when compared to other Canadian equity funds. This article is not a recommendation to abandon high quality investing, but as a reminder that historically winning strategies will likely have periods when the strategy is out of favour.
Quality Indices
One of the major index providers maintains indices of higher quality companies. Factors affecting inclusion in the index are high return on equity, low financial leverage, and earnings growth stability. Based on these factors, higher quality Canadian equity performance trailed that of broad based Canadian equities in 2016 (12.8% to 21.2%). However, this was the first time since 2008 that higher quality Canadian equities did not outperform broad based Canadian equities. Additionally, over the past ten years (ended February 28 2017), high quality Canadian equities outperformed broad based Canadian equities (7.4% vs 4.7% annualized). In dollar terms, a hypothetical $10,000 investment over ten years would have resulted in a $10,496 gain in the quality index and a much smaller $5,769 gain in the broad index. For more information on these quality indices, refer to the following links:
Canada index
US index
world index
Canadian Equity Mutual Funds
2016’s negative correlation between quality and performance manifested in the Canadian Equity mutual fund category. The following scatterplot shows funds in the category (the grey dots) with 2016 performance on the horizontal axis. On the vertical axis is the measure of quality, return on equity (ROE)1 . Although the negative correlation can be seen in the distribution of grey dots, the trend is more clearly represented in the slope of the blue trend line2 . Perhaps more interesting, however, is how most of the higher quality Funds in the category outperformed the 12.8% return of the high quality index mentioned above. This further supports the case for active management; in this case against a strategic beta (quality factor) passive strategy.
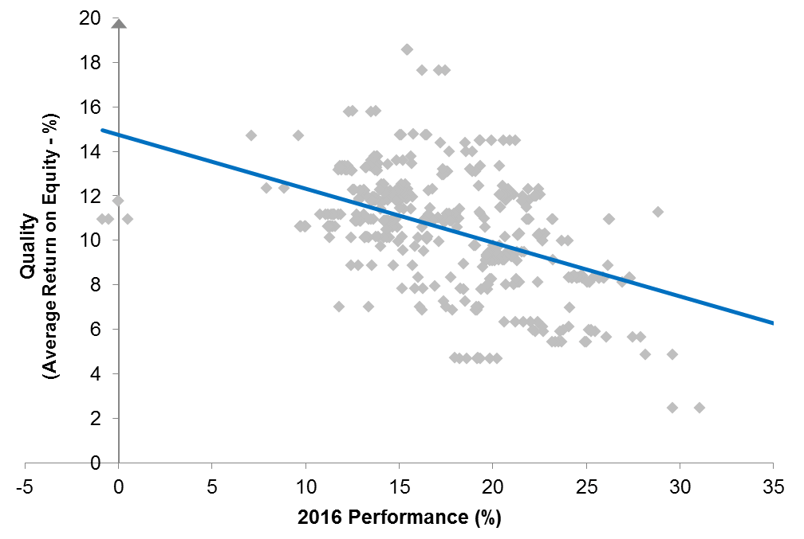
(source: Morningstar Direct; as at December 31, 2016)
Longer term trends reinforce the benefits of a high quality strategy. Extending the data window out a further two years, the following three year scatterplot overcomes 2016’s challenging dynamics and results in a positively sloping trend line, translating to a positive correlation between quality and performance.
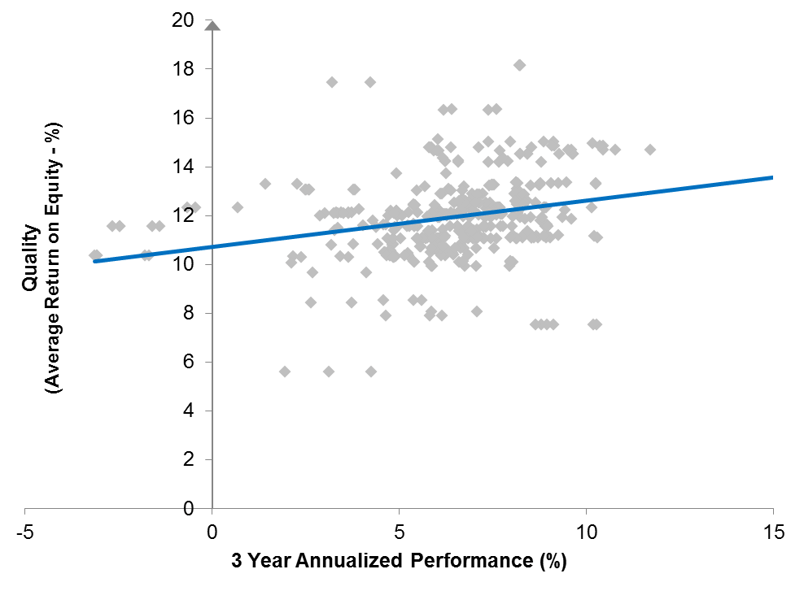
(source: Morningstar Direct; as at December 31, 2016)
Investing in high quality companies at attractive valuations remains a core strategy at Empire Life Investments. We recognize the ebbs and flows of market sentiment may result in our style being out of favour for periods, but we remain disciplined to deliver on our goal of building wealth over the long term for our clients with reduced downside risk.
1 Linear regression trend line
2 ROE is the profit generated by shareholders’ capital; a higher ROE translates to a higher quality company from a stockholder’s perspective