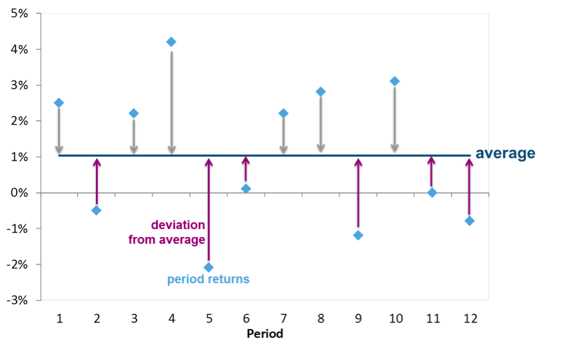
Semi-deviation (also called downside deviation) is a variation of the more commonly used metric, standard deviation. Both measures track the historic variability of returns around an investment’s average return, however, semi-deviation only considers those returns that fall below the investment’s average. A lower semi-deviation indicates an investment with lower downside risk.
The following image illustrates the two metrics; the arrows representing the deviations of each return from the average. Standard deviation accounts for both grey and purple arrows, while semi-deviation only accounts for the purple arrows.

For illustrative purposes only
Minimizing downside risk is nothing if performance is not considered. After all, an investment may have zero downside risk, such as Canadian Treasury Bills, but the associated returns may not be sufficient to meet an individual’s financial goals. Therefore, metrics that consider risk and returns are important.
The Sortino ratio is a derivation of the more commonly used metric, the Sharpe ratio. Both measure an investment’s excess return divided by the amount of risk taken to generate that return (excess returns being the return generated over and above that of a risk-free investment, such as T-bills). The Sortino ratio uses semi-deviation as its measure of risk, while the Sharpe ratio uses standard deviation, therefore the Sortino ratio would be more appropriate for evaluating downside protection. A higher ratio reflects a better risk-adjusted return.

The downside capture ratio is a slightly more complex measure of downside protection. It measures the average performance of an investment relative to a benchmark in periods when the benchmark is down. A downside capture ratio of less than 100% means the investment lost less than the benchmark on average. A ratio of 100% means the investment lost as much as the benchmark. A ratio greater than 100% means the investment lost more than the benchmark. Therefore the lower the downside capture ratio, the better the downside protection.
On the flip side, the upside capture ratio measures the average performance of an investment relative to a benchmark in periods when the benchmark is up. Higher upside capture ratios reflect better up-market performance.
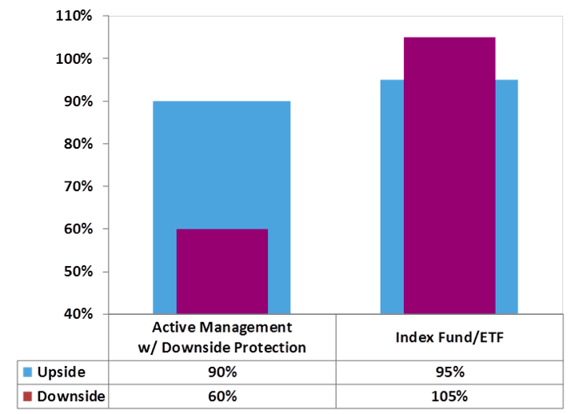
If utilizing capture ratios to evaluate performance, it is important that the investment demonstrates a higher upside capture ratio and lower downside capture ratio. This results in a wide positive spread between the two, and a good rule of thumb is having a 20-30% positive spread. In implementing a downside protection strategy, a result may be moderately reduced upside potential (an upside capture ratio of less than 100%). Therefore, an investment with an upside capture ratio of around 90% and a downside capture ratio around 60% would reflect a manager that has done well protecting in down markets and participating in up markets.
Active management is required to achieve this wide positive spread between the upside and downside capture ratios. Passively investing in an index mutual fund or ETF should not work, since its goal is to match the benchmarks’ performance - not beat the benchmark or be different from it. In this case, both the upside and downside capture ratios should be 100% - if the passive manager is doing their job perfectly! However, after fees are accounted for, no matter how low they are, the result is a higher downside capture ratio and a lower upside capture ratio, which results in a negative spread between the two and is not a desired outcome for investors seeking downside protection.
Ideal capture ratios – active vs passive
For illustrative purposes only

